 ar
ar bg
bg hr
hr cs
cs da
da nl
nl fi
fi fr
fr de
de el
el hi
hi it
it ko
ko no
no pl
pl pt
pt ro
ro ru
ru es
es sv
sv tl
tl iw
iw id
id lv
lv lt
lt sr
sr sk
sk sl
sl uk
uk vi
vi et
et hu
hu th
th tr
tr fa
fa ms
ms hy
hy ka
ka ur
ur bn
bn mn
mn ta
ta kk
kk uz
uz ku
ku
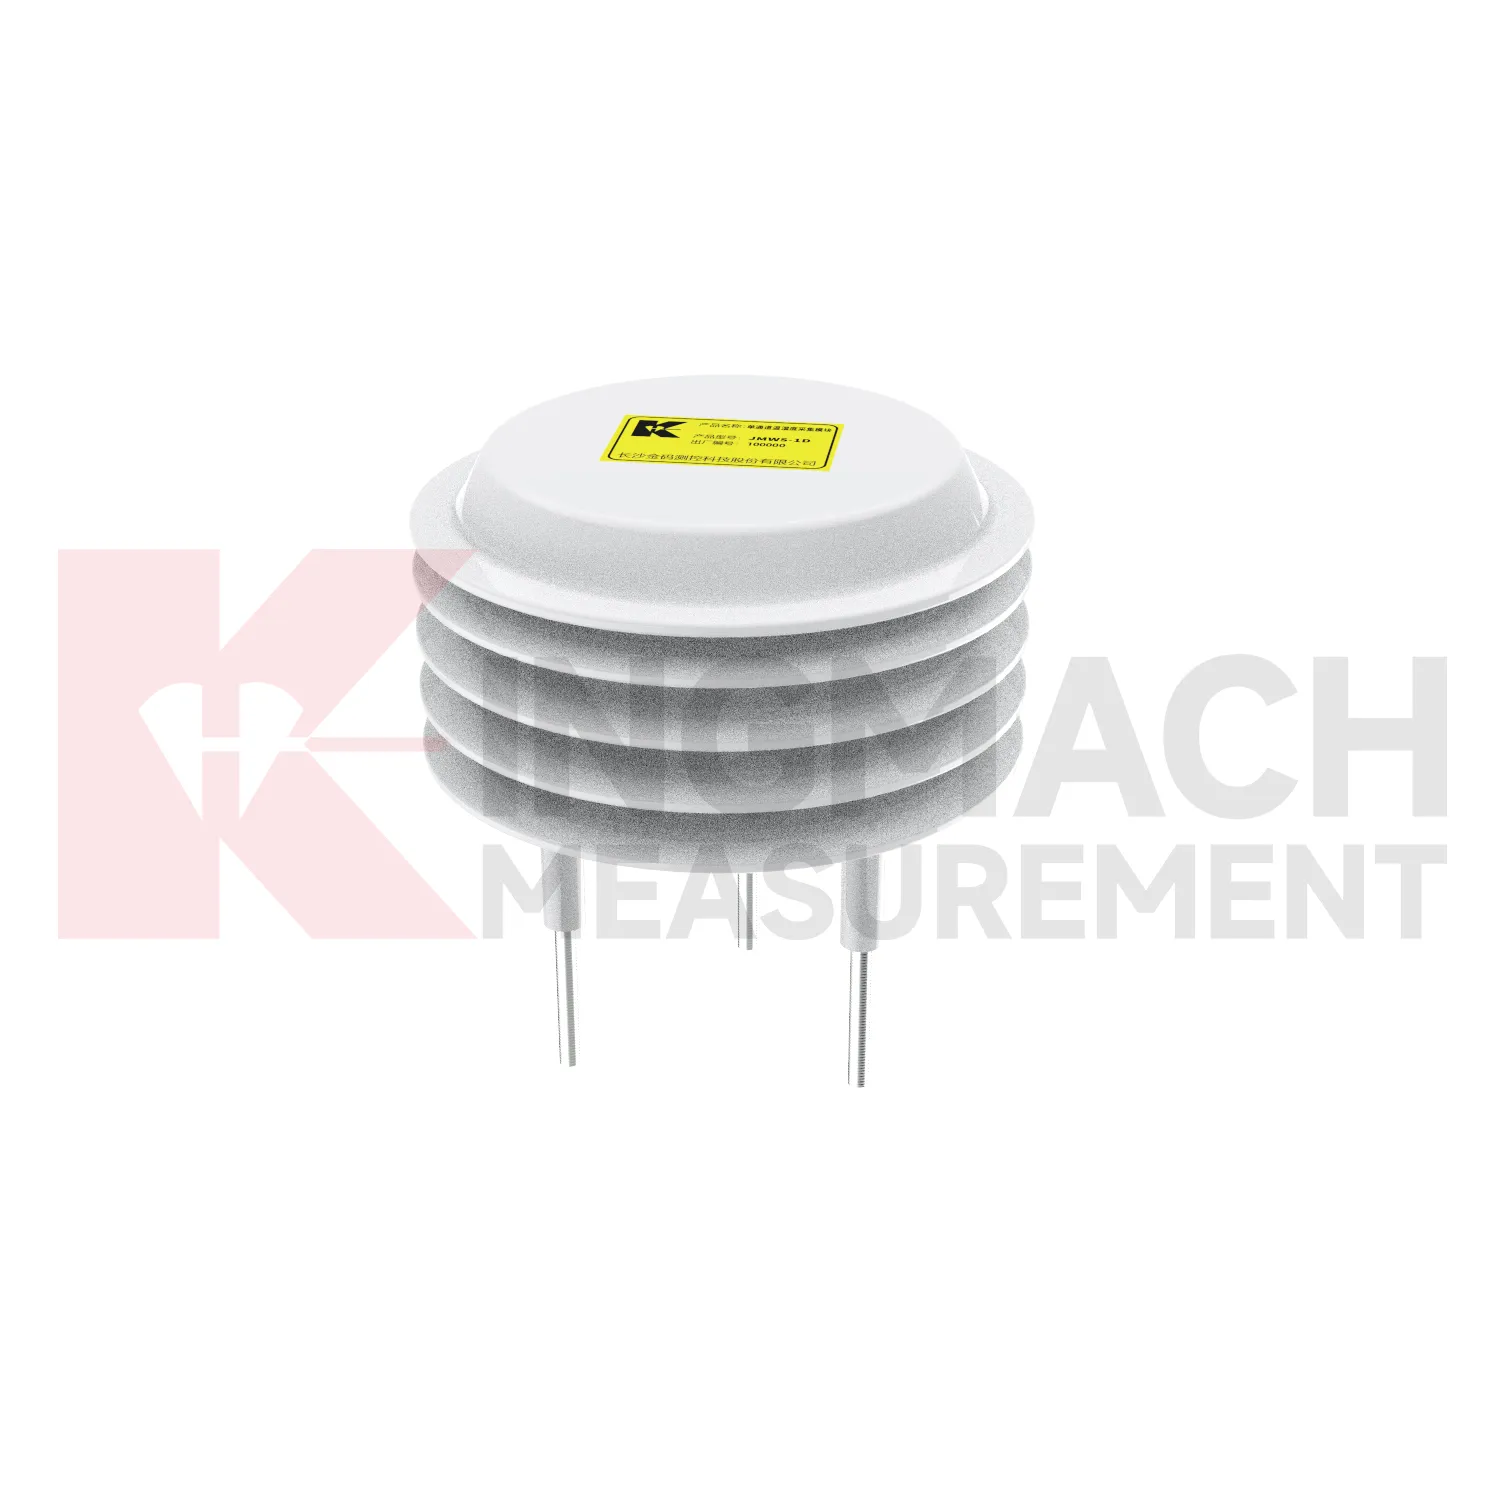
ambient temperature sensor resistance
Kingmach ambient temperature sensor resistance covers the site-condition layer of structural and geotechnical monitoring. It records the environmental forces and operating conditions that often explain why a structural sensor changes. Rainfall can precede slope movement or seepage; soil wetness can show whether water has reached a sensitive layer; temperature can affect strain, expansion, and sensor behavior; humidity can reveal cabinet and tunnel risks; wind can explain vibration, pressure, and access constraints. A useful description of this category should therefore start with the monitoring problem. The equipment is not installed to fill a dashboard with weather values. It is installed so engineers can compare conditions with settlement, displacement, tilt, load, vibration, strain, inspection notes, and maintenance actions. When these records share time stamps and point names, the owner can see both the trigger and the response. That makes abnormal-event review faster and helps long-term reports distinguish seasonal patterns from real deterioration.
If the reading seems unusual, the team should check the physical condition of the station before drawing conclusions about the asset. Blockage, poor exposure, loose wiring, water entry, and changed surroundings can all create misleading patterns.
A practical report links the condition value with time, place, and action. It should help a reviewer decide whether to keep observing, inspect the field point, compare nearby instruments, or record the event as normal site behavior.
Application of ambient temperature sensor resistance
Dam and hydraulic projects use Kingmach ambient temperature sensor resistance to understand the environmental background behind seepage, slope movement, settlement, and inspection planning. Rainfall, soil wetness, temperature, and wind exposure can all influence how a dam site behaves. Environmental records should be reviewed with reservoir level, seepage flow, pore pressure, settlement, displacement, and inspection notes. A single storm may not create immediate movement, but repeated wetting may change the ground condition. Temperature cycles may also affect surface readings, equipment cabinets, and concrete behavior. Monitoring points should be placed where they support the dam-safety question, not merely where installation is easy. Over years, these records help teams distinguish seasonal patterns from new or localized changes that require closer review.
The installation file should explain why the location represents the monitored area. If the point is sheltered, shaded, exposed, buried, elevated, or placed inside an enclosure, that fact changes how later readings should be understood by maintenance staff.
During abnormal events, the first question is not only whether the value crossed a limit. The reviewer should ask what changed around the site, whether the related structure reacted, and whether a field inspection confirmed the same pattern.
Long-term value comes from consistency. A channel that keeps the same location, unit, maintenance history, and linked asset record can support seasonal comparison, post-storm review, and handover between construction and operation teams.
The future of ambient temperature sensor resistance
Future Kingmach ambient temperature sensor resistance will be grouped around engineering questions. A slope group may include rainfall, soil wetness, displacement, tilt, and pore pressure. A bridge group may include wind, temperature, strain, acceleration, and displacement. A tunnel group may include humidity, temperature, seepage, settlement, and convergence. This grouping is more useful than arranging channels only by sensor family. Owners review risks, not instrument categories. When dashboards and reports follow the risk, environmental data becomes easier for field teams to use during both routine review and abnormal events.
Maintenance teams should record cleaning, access difficulty, enclosure condition, cable repair, vegetation growth, nearby equipment changes, and the first normal reading after work. Those notes protect the meaning of the curve when old data is reviewed months later.
The environmental point should be part of a named monitoring question. It may explain wetting, drying, wind exposure, thermal movement, cabinet stress, or pressure variation, but that purpose needs to be visible in drawings and reports.
Care & Maintenance of ambient temperature sensor resistance
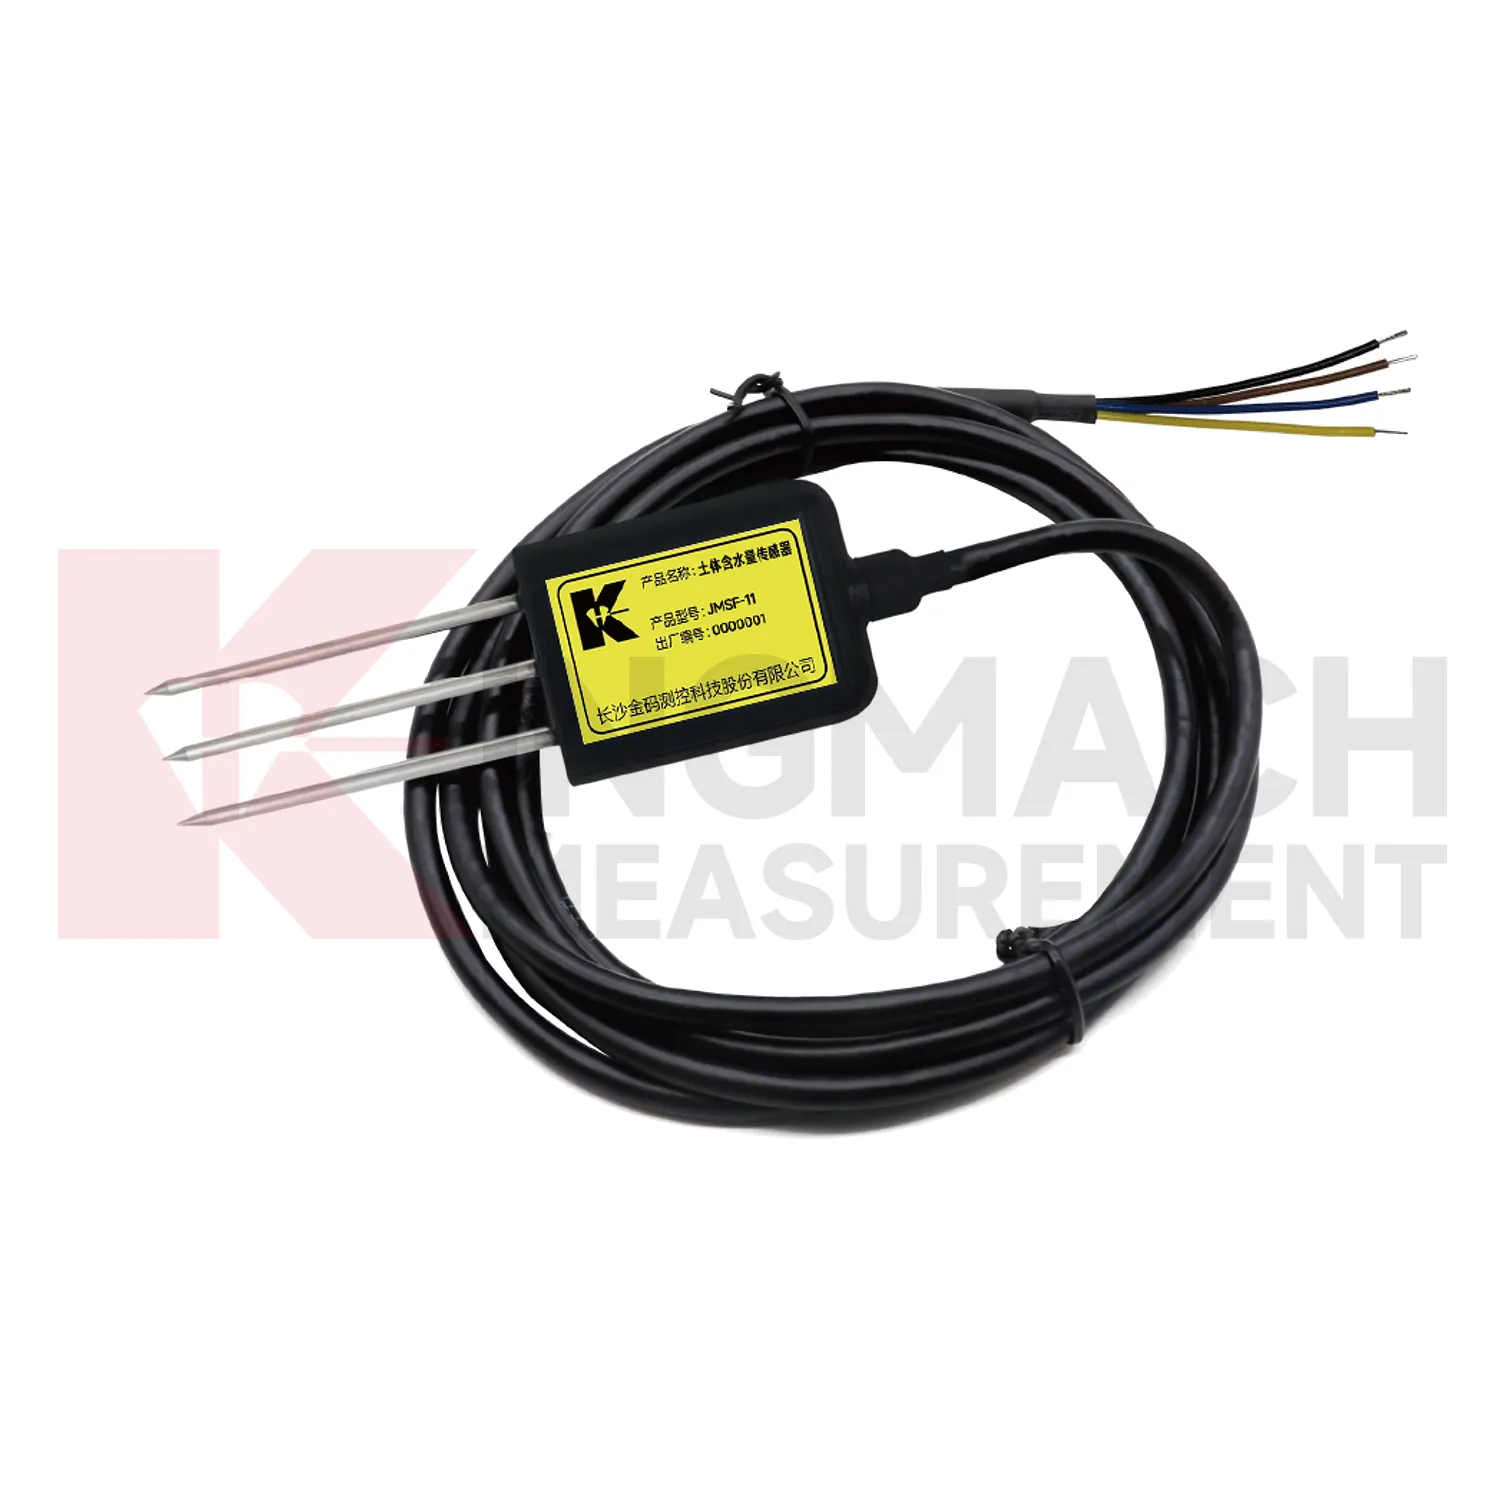
Soil-condition maintenance for Kingmach ambient temperature sensor resistance should protect the contact between the buried point and the surrounding material. Air gaps, disturbed soil, cable damage, excavation, animal activity, or water paths along the cable can all affect readings. Installation records should include depth, soil type, location photo, cable route, and first stable value. During review, compare soil wetness with rainfall, irrigation, groundwater, and nearby deformation. If a buried channel becomes flat or jumps suddenly, inspect cable continuity and recent site work before treating it as a real soil change. Buried points are easy to forget, so their maintenance history must be visible in the project file.
If the reading seems unusual, the team should check the physical condition of the station before drawing conclusions about the asset. Blockage, poor exposure, loose wiring, water entry, and changed surroundings can all create misleading patterns.
A practical report links the condition value with time, place, and action. It should help a reviewer decide whether to keep observing, inspect the field point, compare nearby instruments, or record the event as normal site behavior.
Kingmach ambient temperature sensor resistance
A strong Kingmach ambient temperature sensor resistance plan keeps the writing and the system focused on site conditions rather than product lists. The page should help a reader understand how weather, moisture, pressure, temperature, and humidity affect the assets they are responsible for. It should explain how environmental readings support slope review, bridge response, tunnel operation, dam inspection, irrigation control, construction records, and long-term maintenance. It should not read like a catalog of devices or a compressed specification table. The buyer needs a monitoring approach that connects field conditions with engineering decisions. That approach is what makes environmental data worth collecting over months and years.
Maintenance teams should record cleaning, access difficulty, enclosure condition, cable repair, vegetation growth, nearby equipment changes, and the first normal reading after work. Those notes protect the meaning of the curve when old data is reviewed months later.
The environmental point should be part of a named monitoring question. It may explain wetting, drying, wind exposure, thermal movement, cabinet stress, or pressure variation, but that purpose needs to be visible in drawings and reports.
FAQ
Q: Where should a rain point be placed?
A: It should be level, open to the sky, and away from obstructions, splash sources, roof edges, and debris-prone areas.
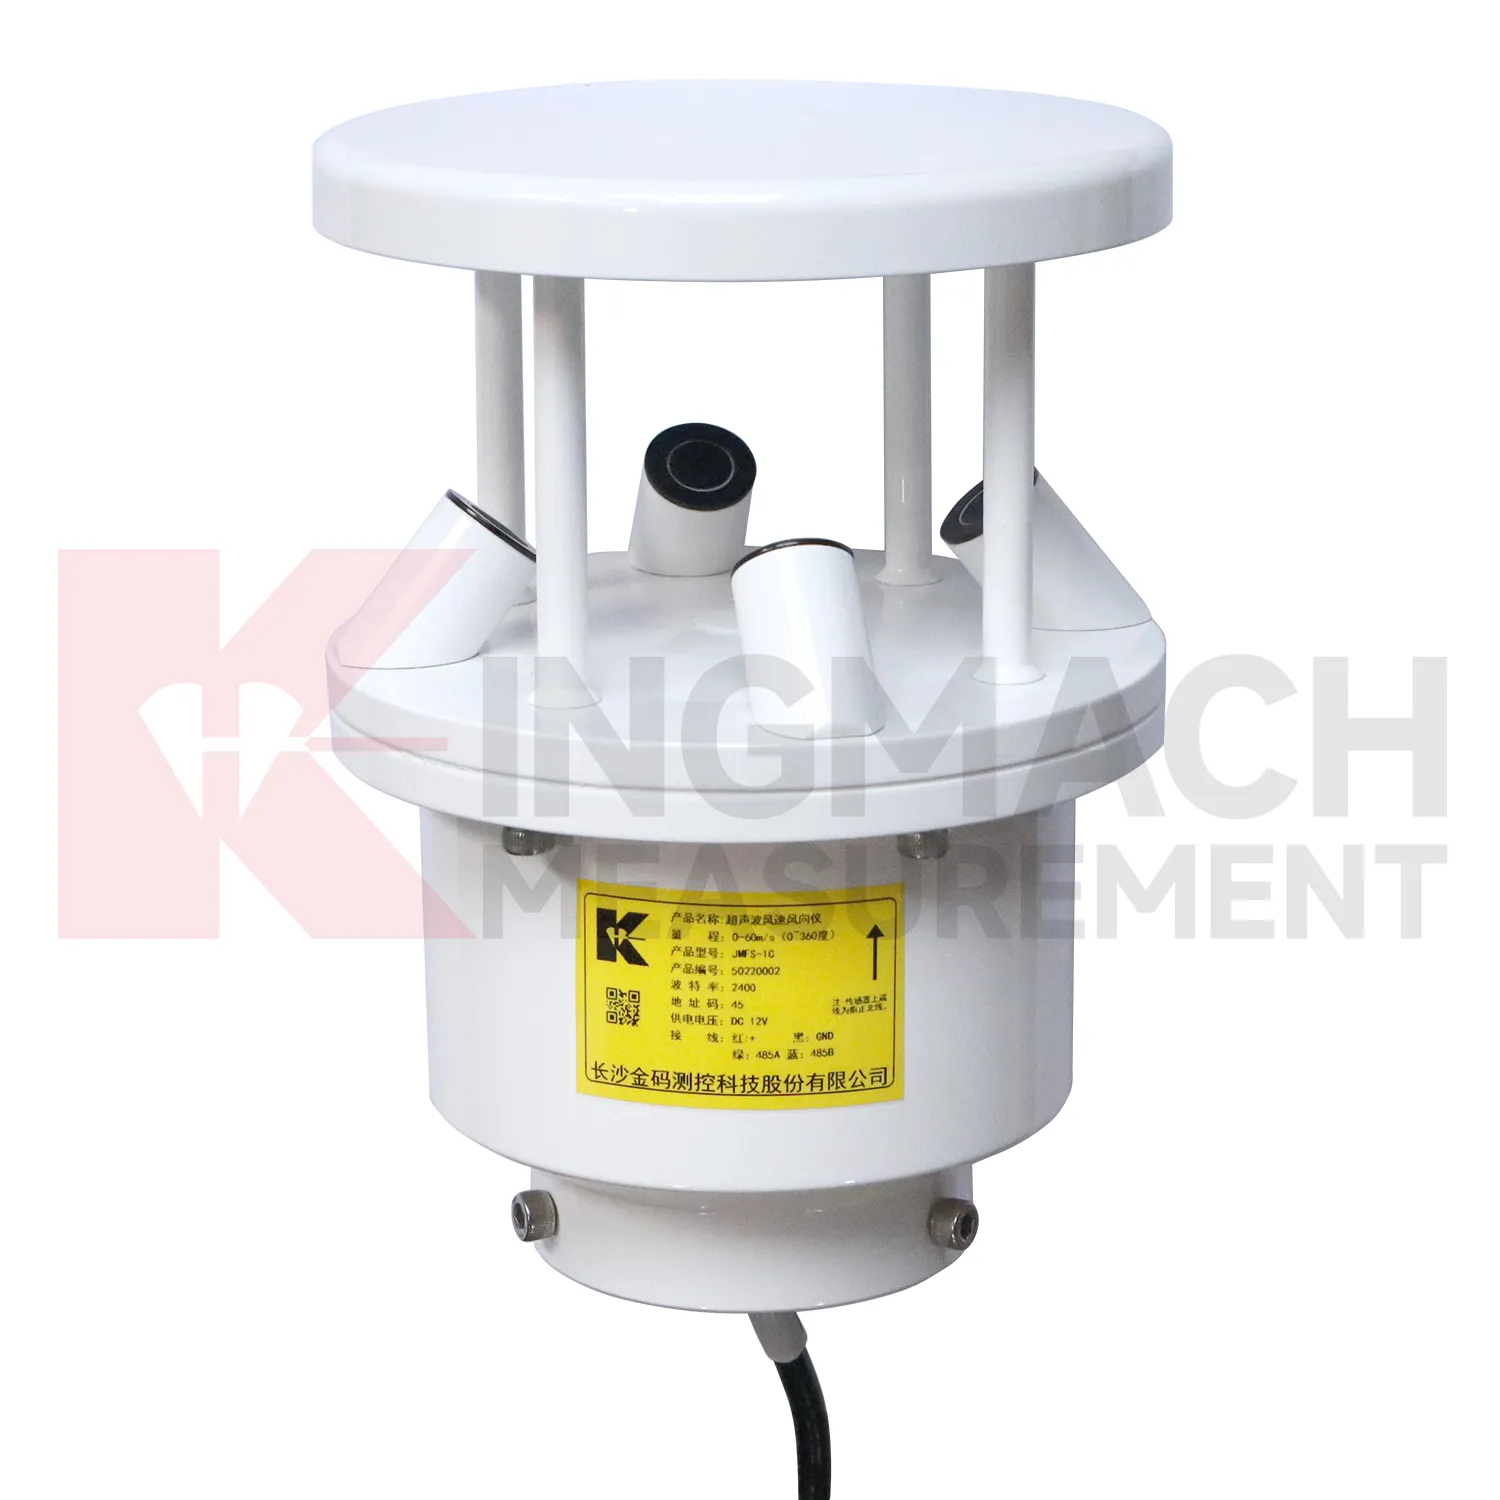
Q: Where should wind be measured?
A: Wind should be measured where airflow represents the asset or work area being reviewed, not behind a wall or sheltered obstruction.
Q: How should soil points be installed?
A: They should have firm contact with the surrounding soil, a recorded depth, protected cable route, and a stable first value.
Q: What should commissioning records include?
A: Include point location, measured condition, unit, mounting photo, cable route, power source, data channel, and linked structural record.
Q: Why are photos useful?
A: Photos help future reviewers understand exposure, mounting, cable routing, and whether later site changes affected readings.
Maintenance teams should record cleaning, access difficulty, enclosure condition, cable repair, vegetation growth, nearby equipment changes, and the first normal reading after work. Those notes protect the meaning of the curve when old data is reviewed months later.
Reviews
Christopher Martinez
Very satisfied with the readouts & data loggers. User-friendly interface and supports multiple sensor inputs.
Andrew Lee
The visualization software is intuitive and powerful. It helps us analyze monitoring data efficiently.
Latest Inquiries
To protect the privacy of our buyers, only public service email domains like Gmail, Yahoo, and MSN will be displayed. Additionally, only a limited portion of the inquiry content will be shown.
Amelia***@gmail.comSingapore
Hello, I am looking for visualization software for monitoring system data analysis. Please let me kn...
Charlotte***@gmail.comUnited Arab Emirates
Hi, we require instrumentation cables suitable for harsh environments. Could you advise on specifica...
Related product categories
- wind direction and speed sensor
- wind speed and direction sensors
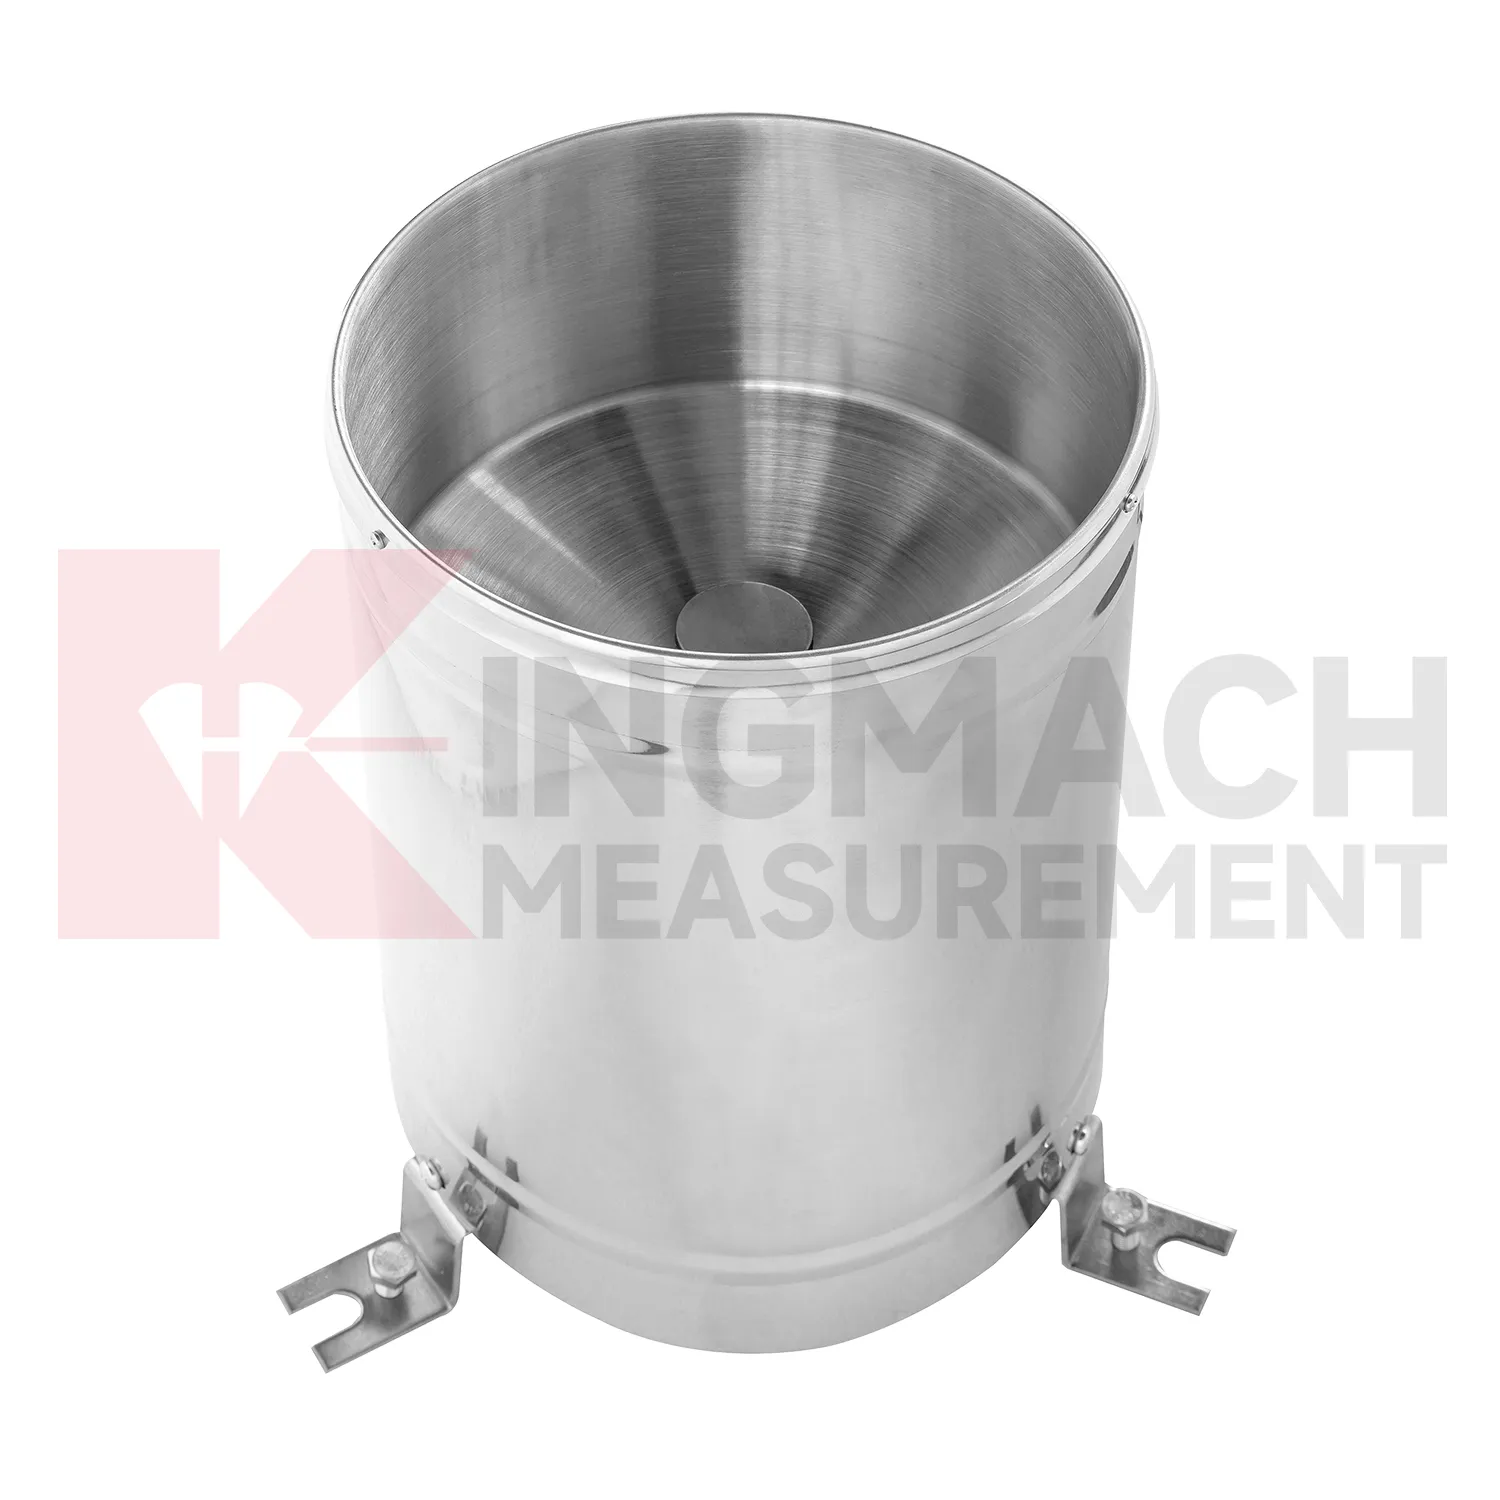
- tipping bucket rain gauge
- tipping bucket rain gauge resolution 0.2 mm standard
- tipping bucket rain gauges
- tipping bucket rain gauge resolution 0.1 mm 0.2 mm standard
- tipping bucket rain gauge resolution 0.1 mm standard
- rain gauge tipping bucket
- tipping bucket rain gauge sensor
- tipping bucket type rain gauge
- tipping rain bucket gauge
- tipping bucket rain gauge 0.2 mm per tip standard