 ar
ar bg
bg hr
hr cs
cs da
da nl
nl fi
fi fr
fr de
de el
el hi
hi it
it ko
ko no
no pl
pl pt
pt ro
ro ru
ru es
es sv
sv tl
tl iw
iw id
id lv
lv lt
lt sr
sr sk
sk sl
sl uk
uk vi
vi et
et hu
hu th
th tr
tr fa
fa ms
ms hy
hy ka
ka ur
ur bn
bn mn
mn ta
ta kk
kk uz
uz ku
ku
load cell connection diagram
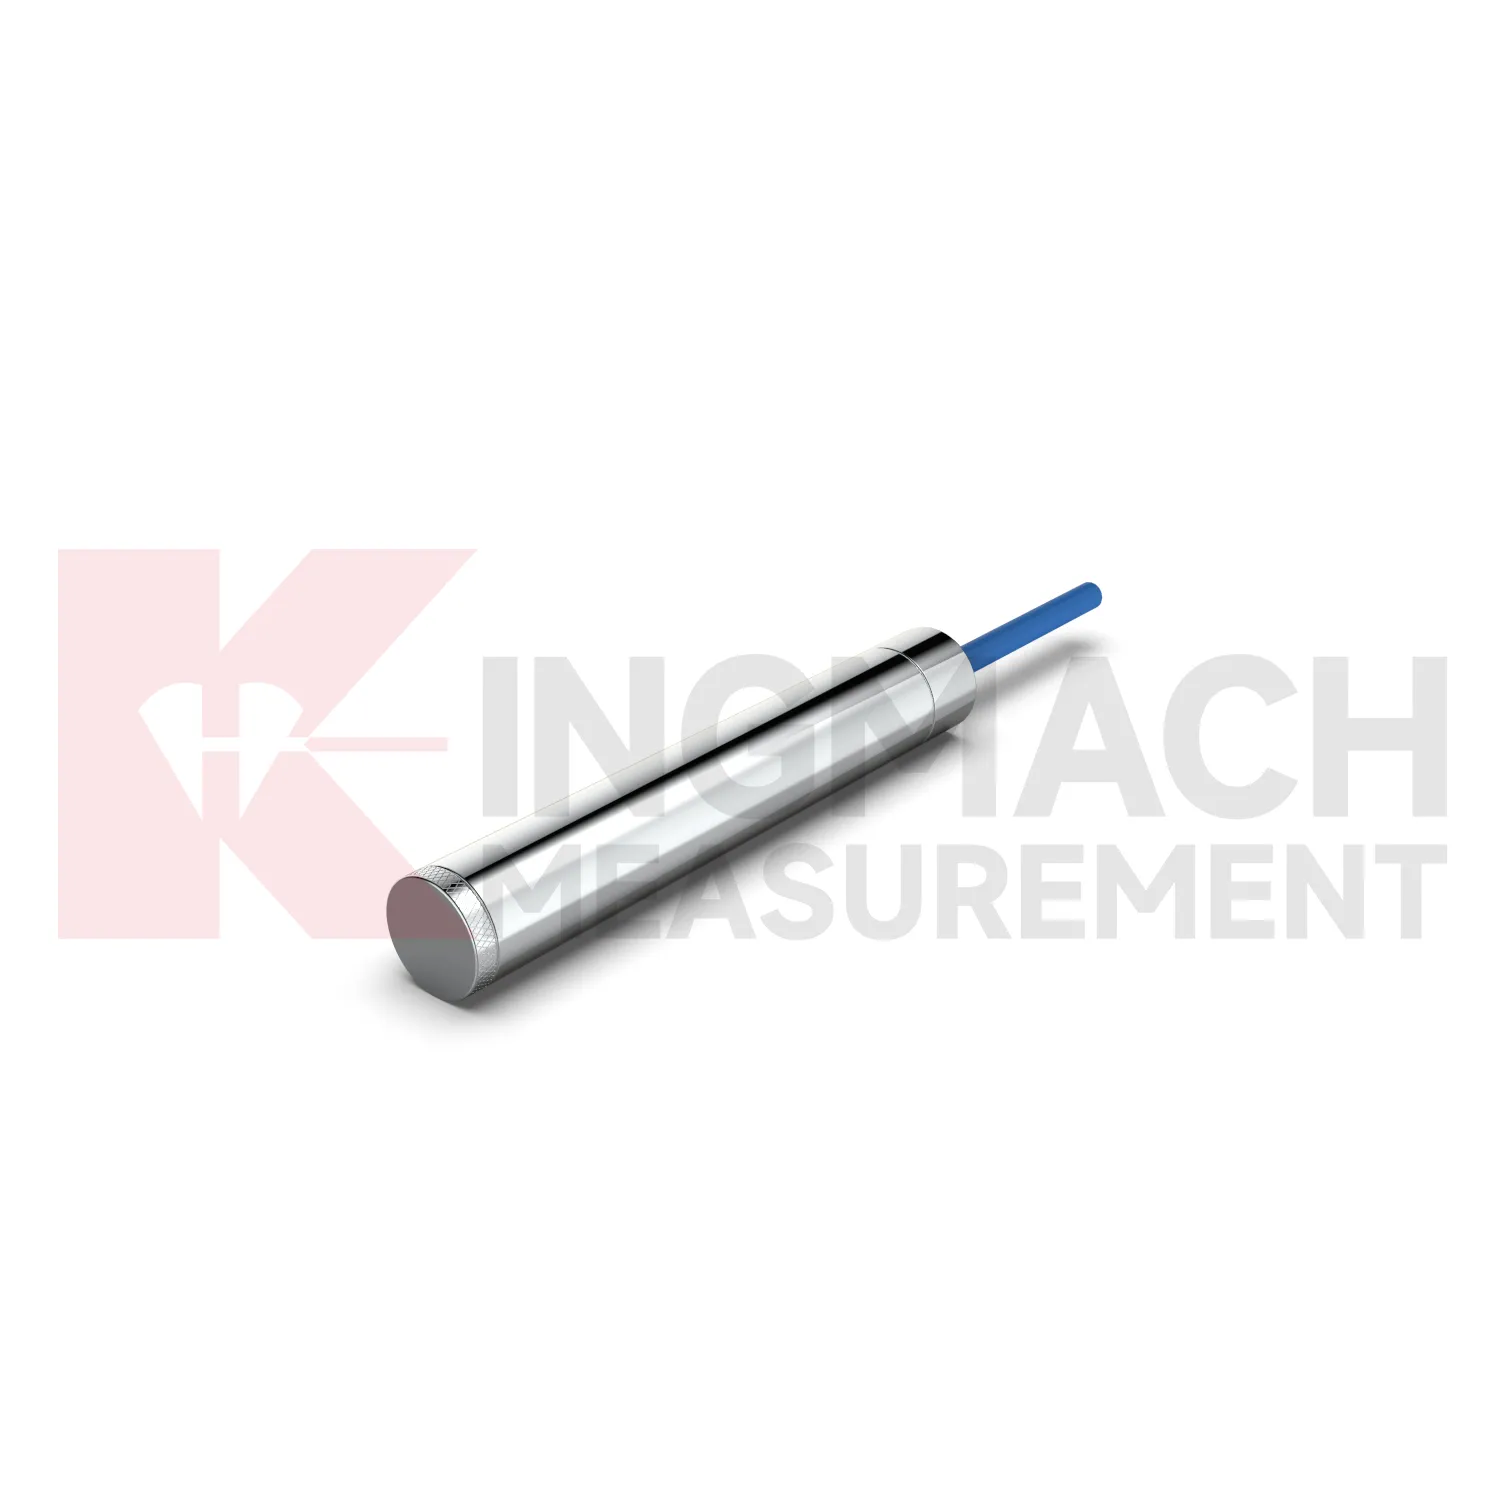
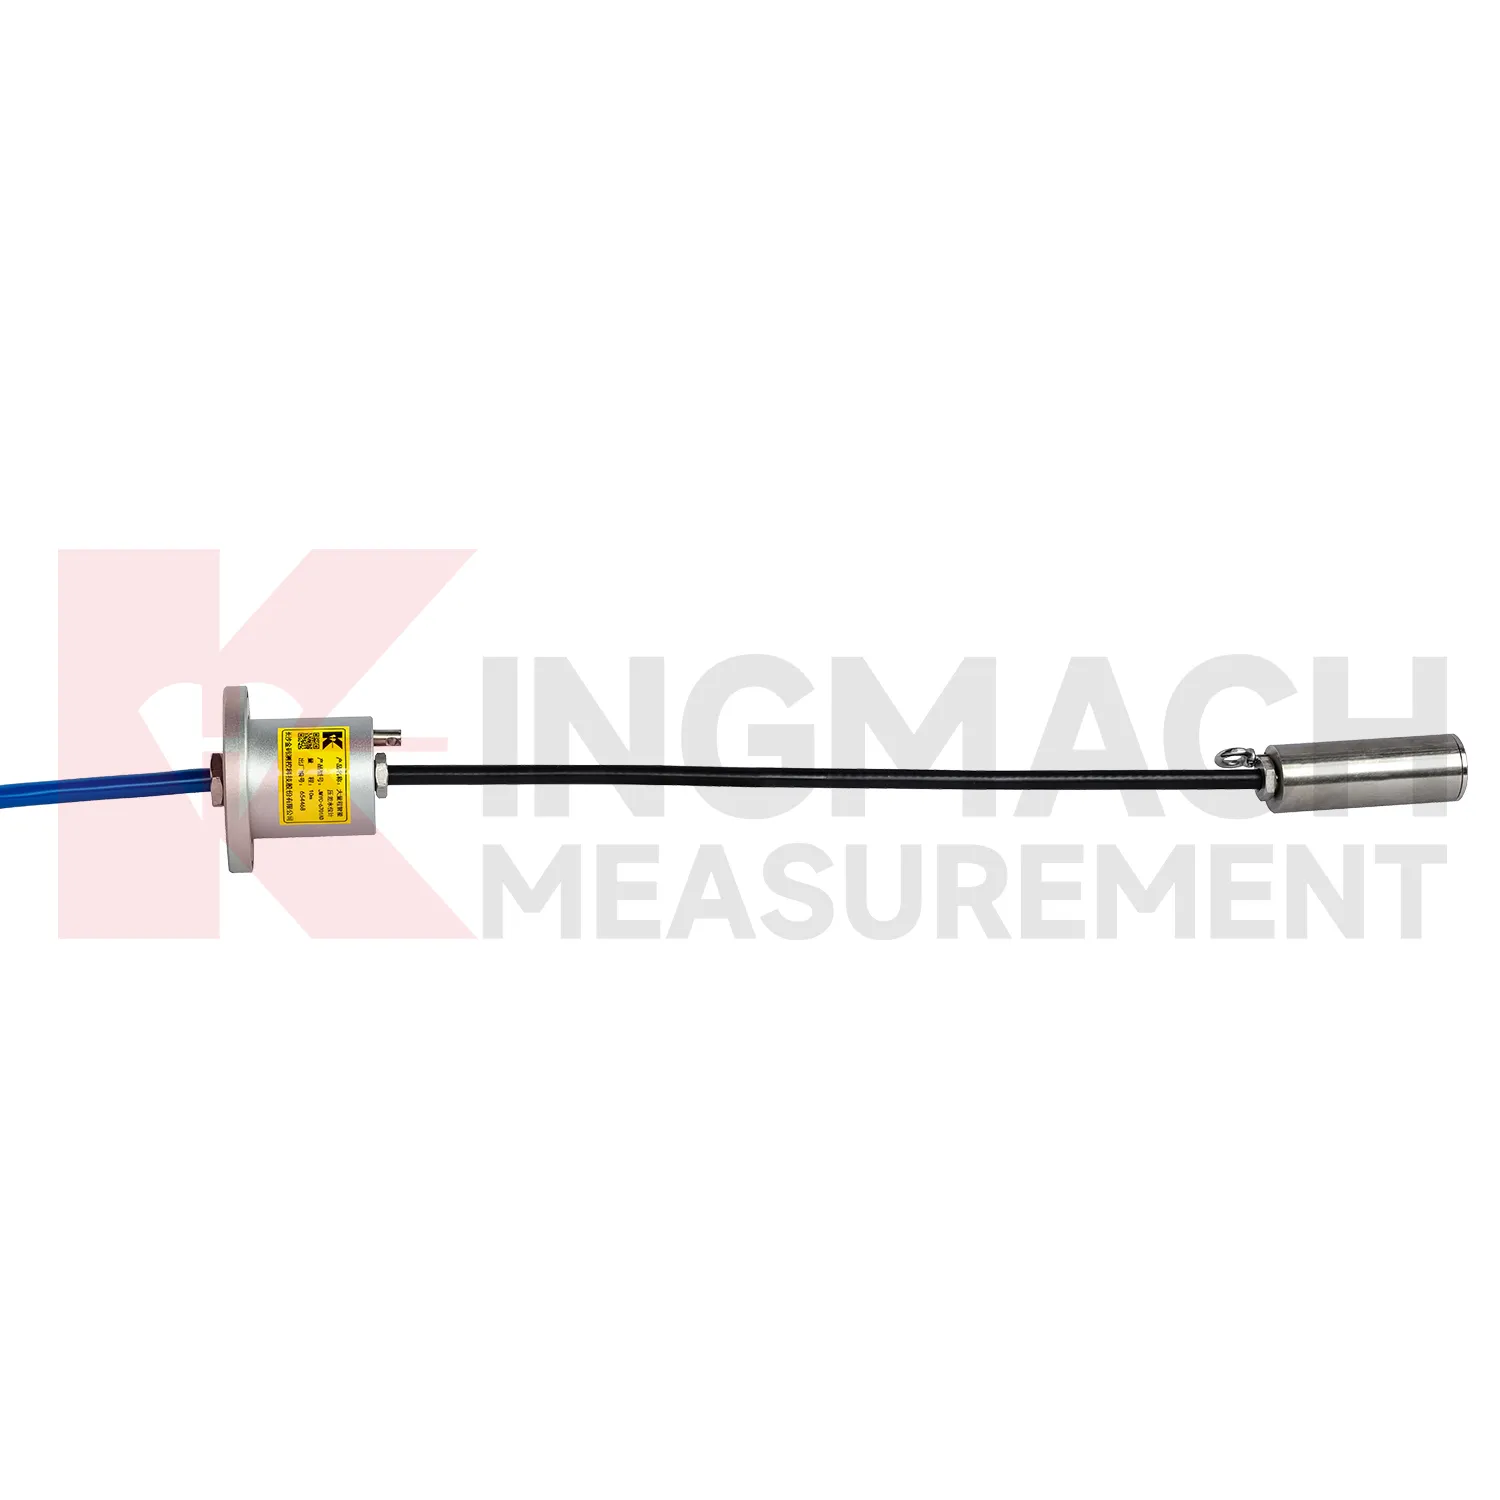
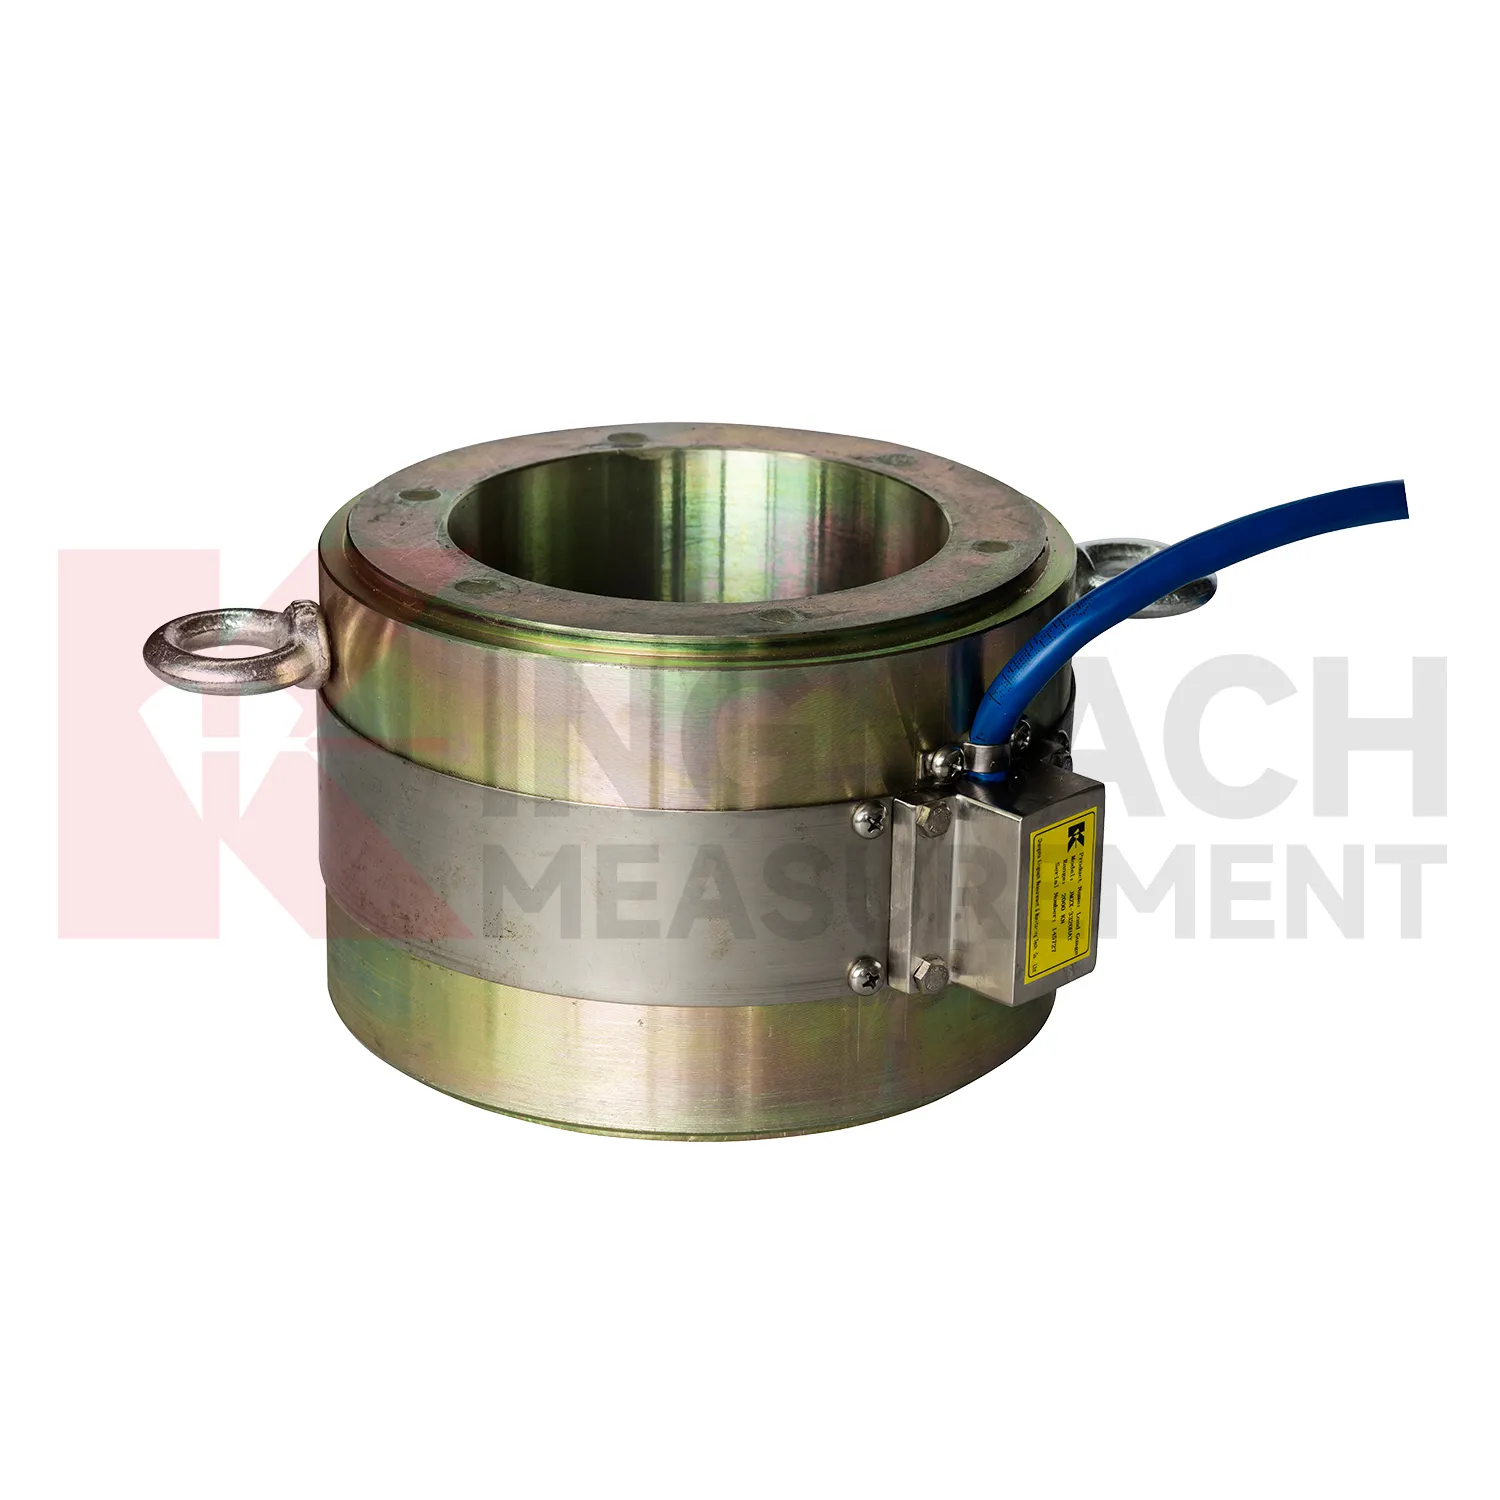
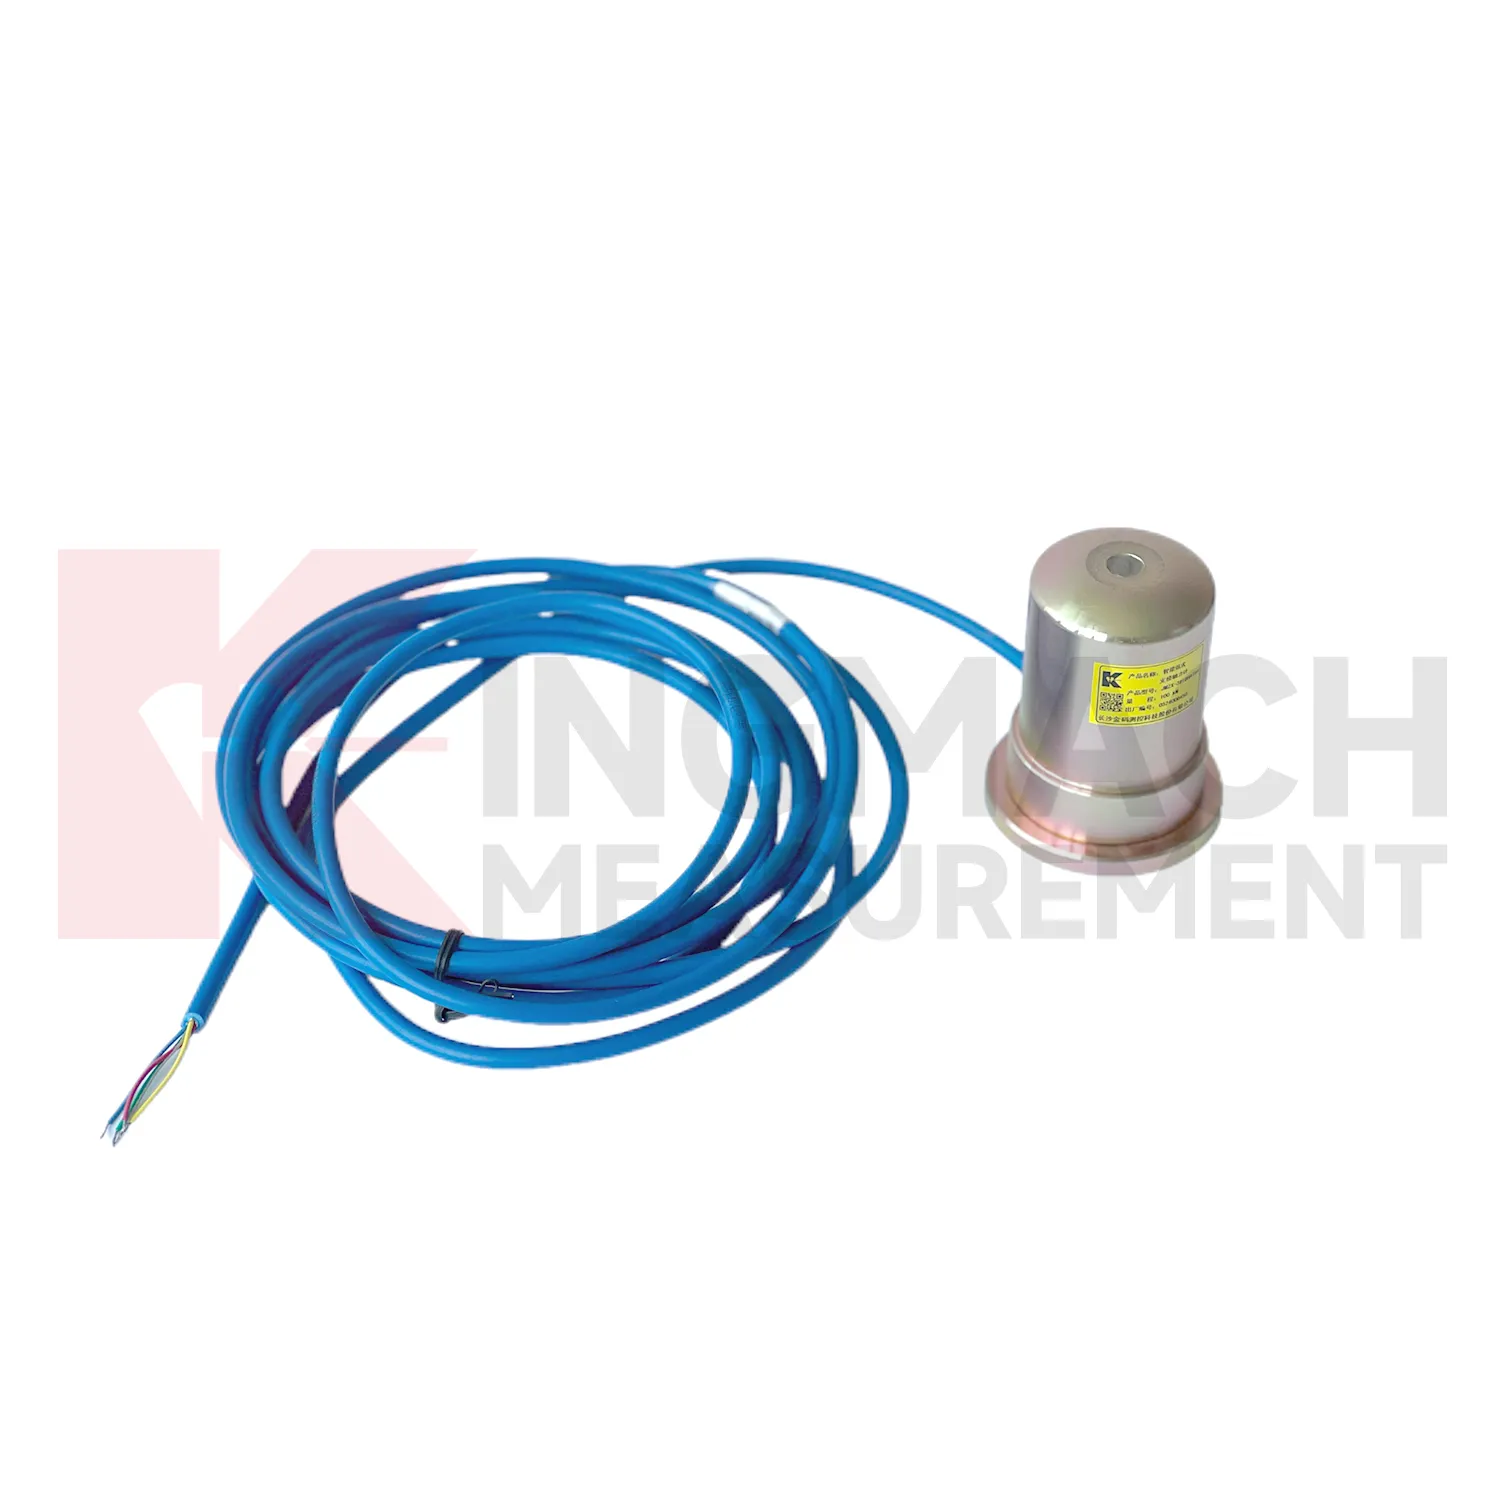
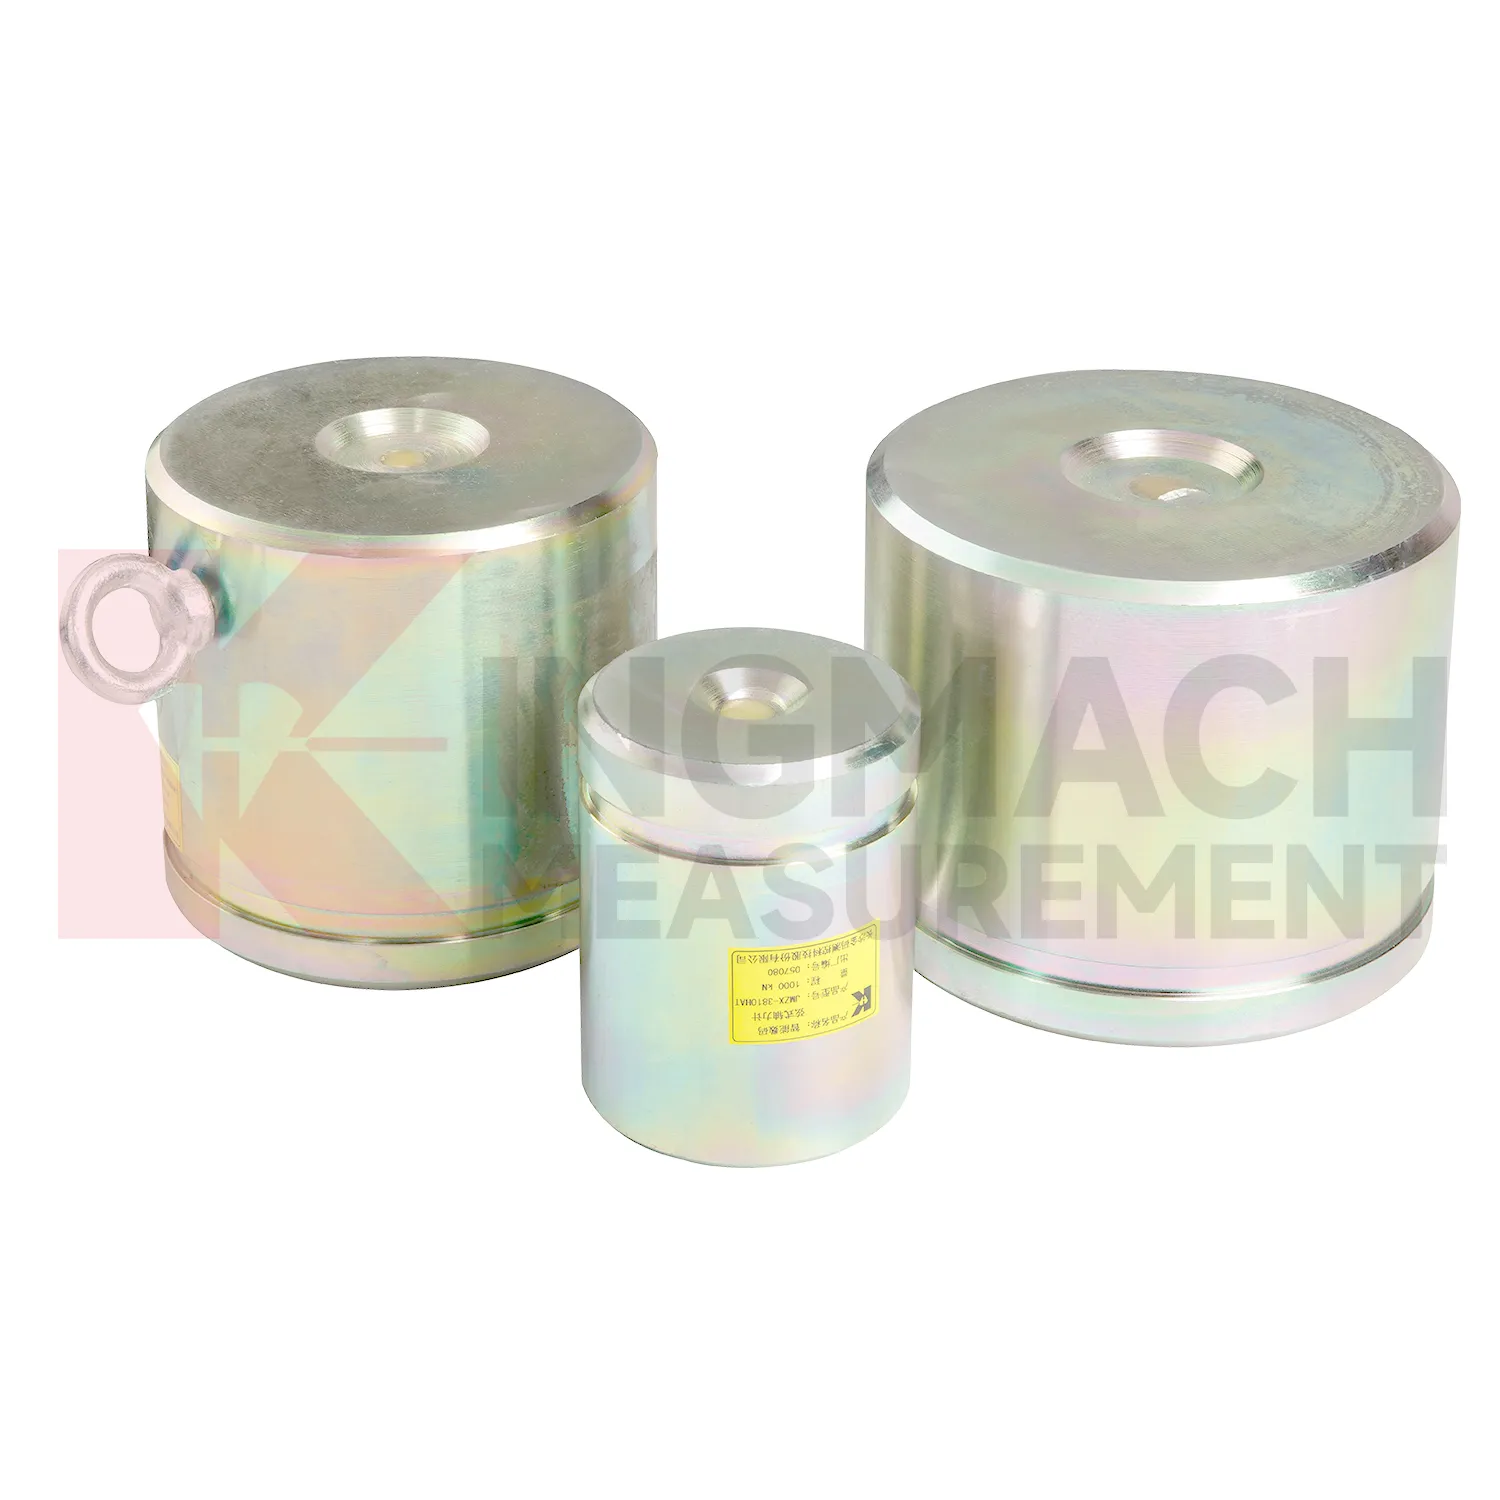
Kingmach load cell connection diagram is developed for civil infrastructure where readings must remain usable after dust, vibration, water, and long cable runs enter the job. Product files describe vibrating wire based designs, smart chips, digital detection, strong anti-interference transmission, waterproof insulation, and automatic temperature correction. On the solid load cell JMZX-35XXHAT, the listed range runs from 1000 kN to 10000 kN with 0.1 kN resolution and 0.5%FS precision. On the hollow JMZX-3XXXHAT series, the listed range covers 500 kN to 8000 kN and the record memory can store 800 measurement entries. On the JMZX-38XXHAT axial force meter, the instrument can display axial force directly in kN. These details suit projects where force monitoring is part of acceptance, construction control, or long term service review. Kingmach's product grouping also supports mixed monitoring networks, where load readings sit beside water level, piezometer, displacement, settlement, and tilt data. For purchasing teams, this means the specification should include not only the sensor body, but also compatible readout equipment, cable length, protection accessories, calibration needs, and the reporting method expected by the owner. That reduces changes after the site work has already started. In practice, this means the specification should name the monitored member, expected reading frequency, installation exposure, and the person responsible for accepting the first stable value.
Application of load cell connection diagram
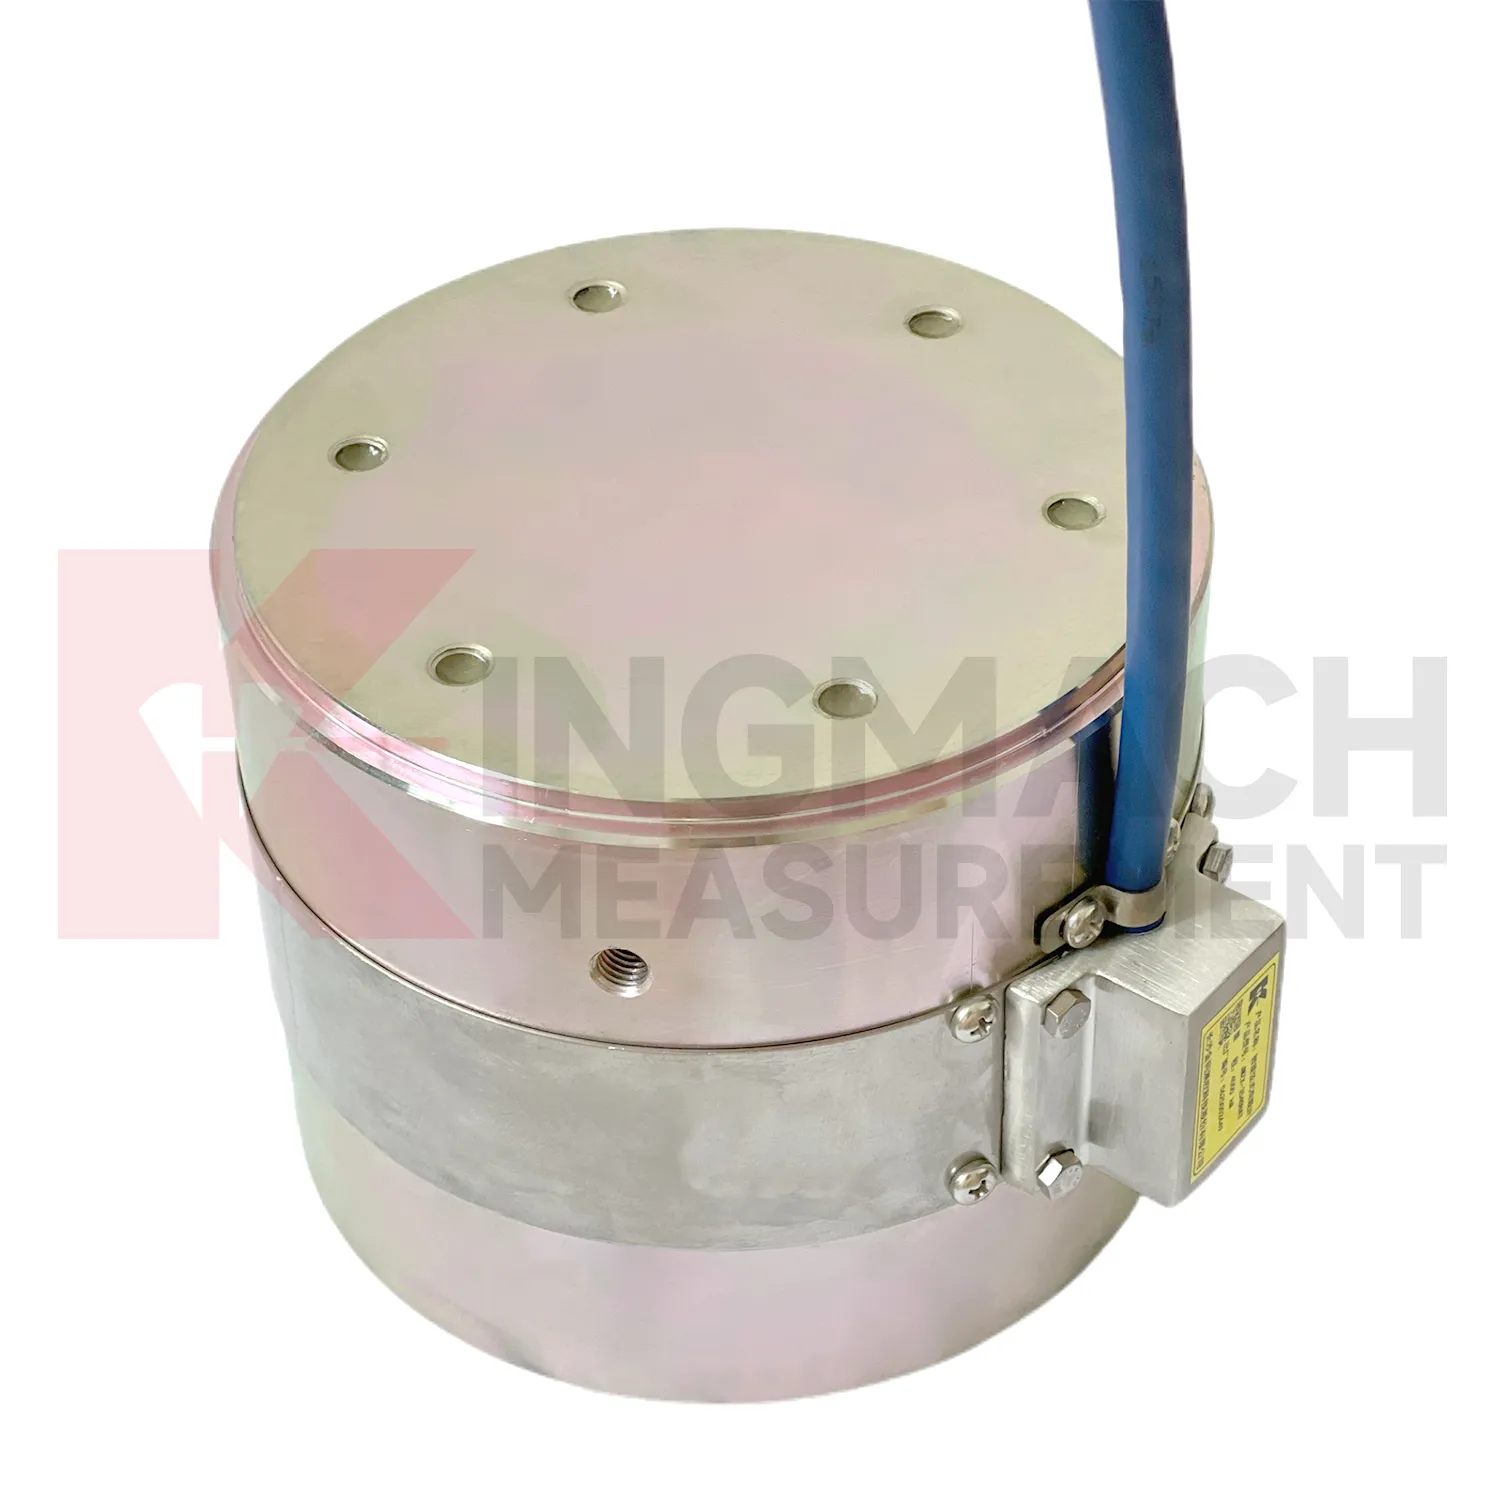
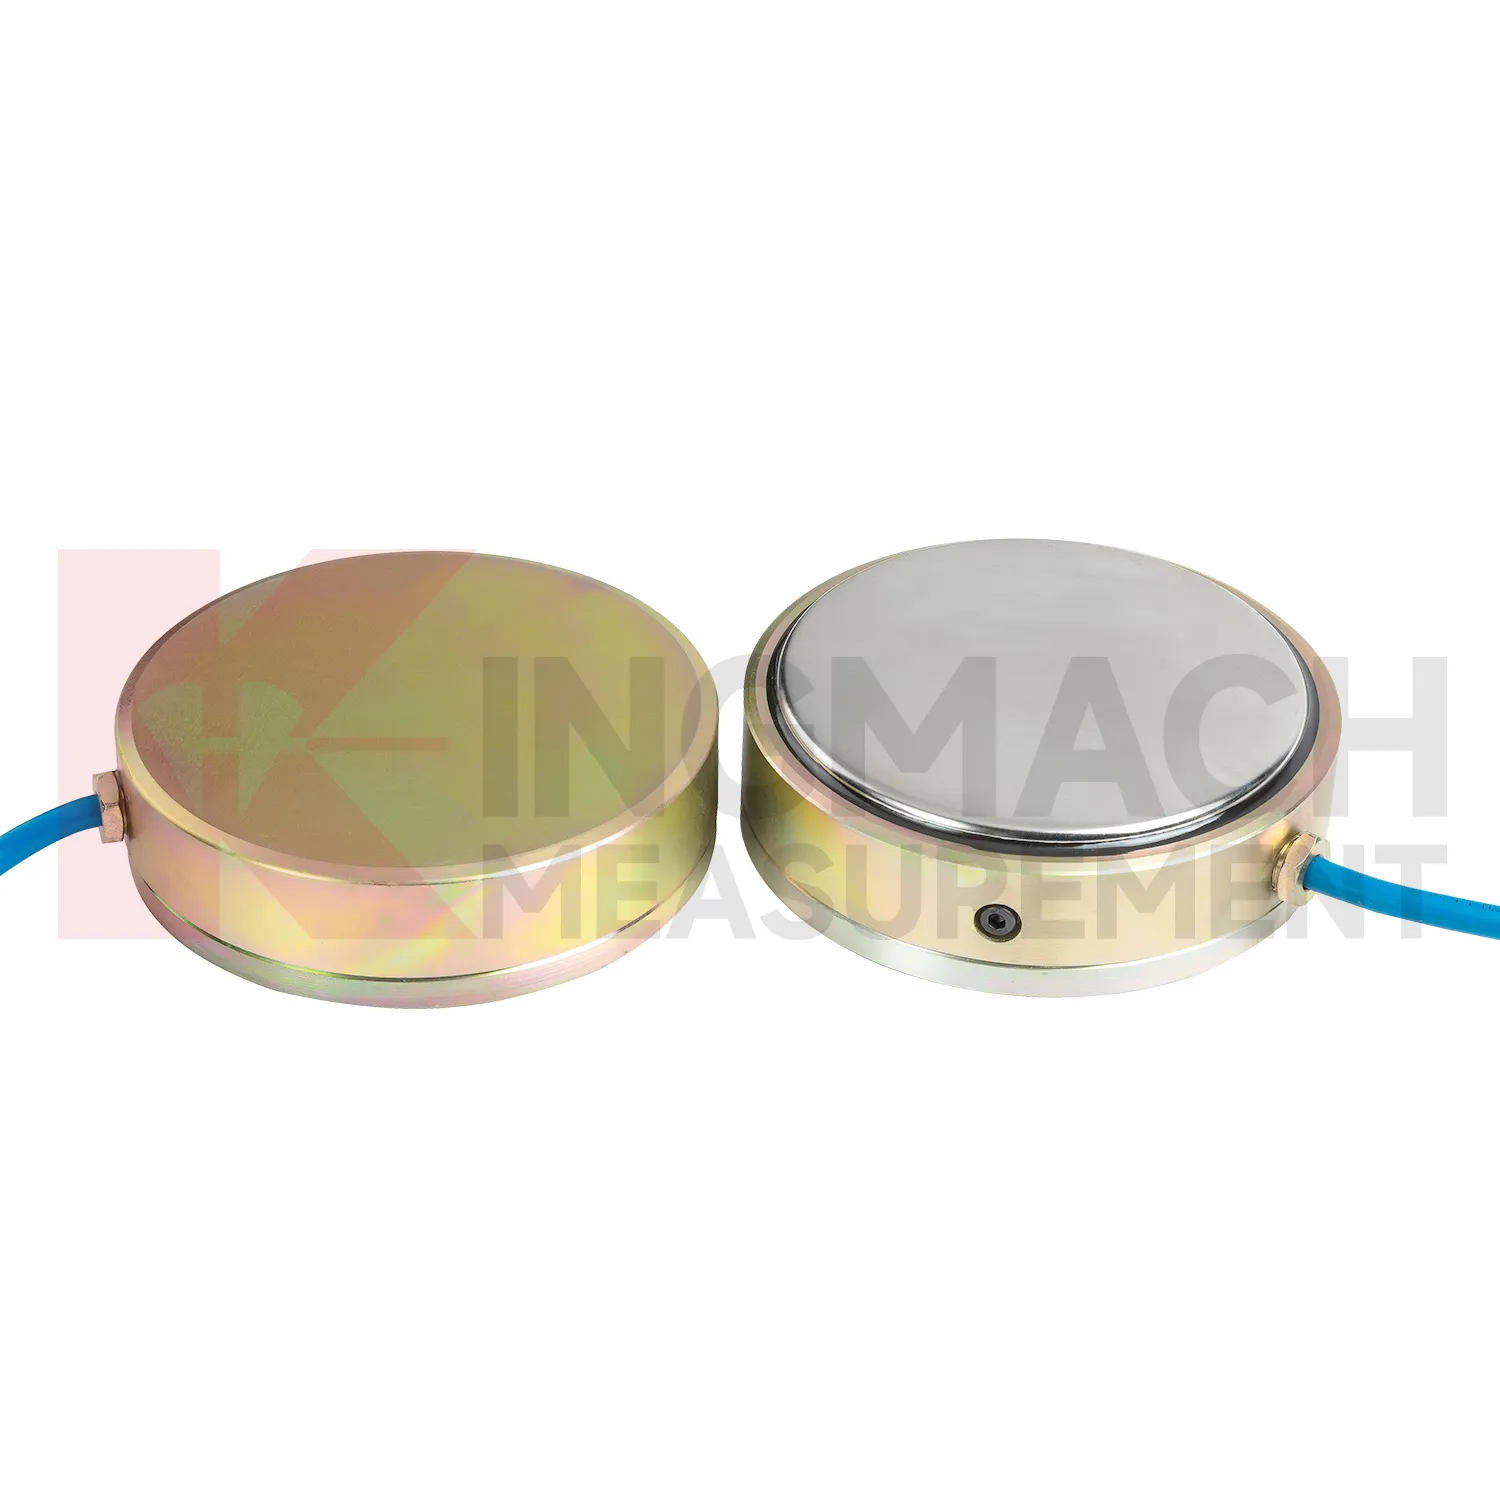
In slope, embankment, and retaining wall projects, load cell connection diagram helps monitor anchor force, slide resistant pile load, earth pressure, and stress change after rainfall or groundwater variation. The practical pain point is that visible slope movement may arrive late, while load and pressure trends may start earlier. Earth pressure cells in the Kingmach range are listed from 0.3 MPa to 8 MPa, with 0.001 MPa resolution, 0.5%FS pressure accuracy, and ±0.5°C temperature accuracy. Hollow load cells for anchor force cover 500 kN to 8000 kN and include temperature correction and waterproof construction. These parameters support long term points in buried, wet, or exposed conditions. Force data should be reviewed with inclinometer, settlement, water level, rainfall, and crack observation records. If anchor force drops while displacement increases, the project team has a different problem than a temporary pressure rise after rain. The instrumentation plan should therefore connect each load point to the ground behavior it is meant to explain. On slopes, cable routes should be protected against rockfall, drainage works, vegetation clearing, and surface runoff. Those mundane details matter because a broken cable can look like a dramatic geotechnical event if the hardware is not inspected first.
The future of load cell connection diagram
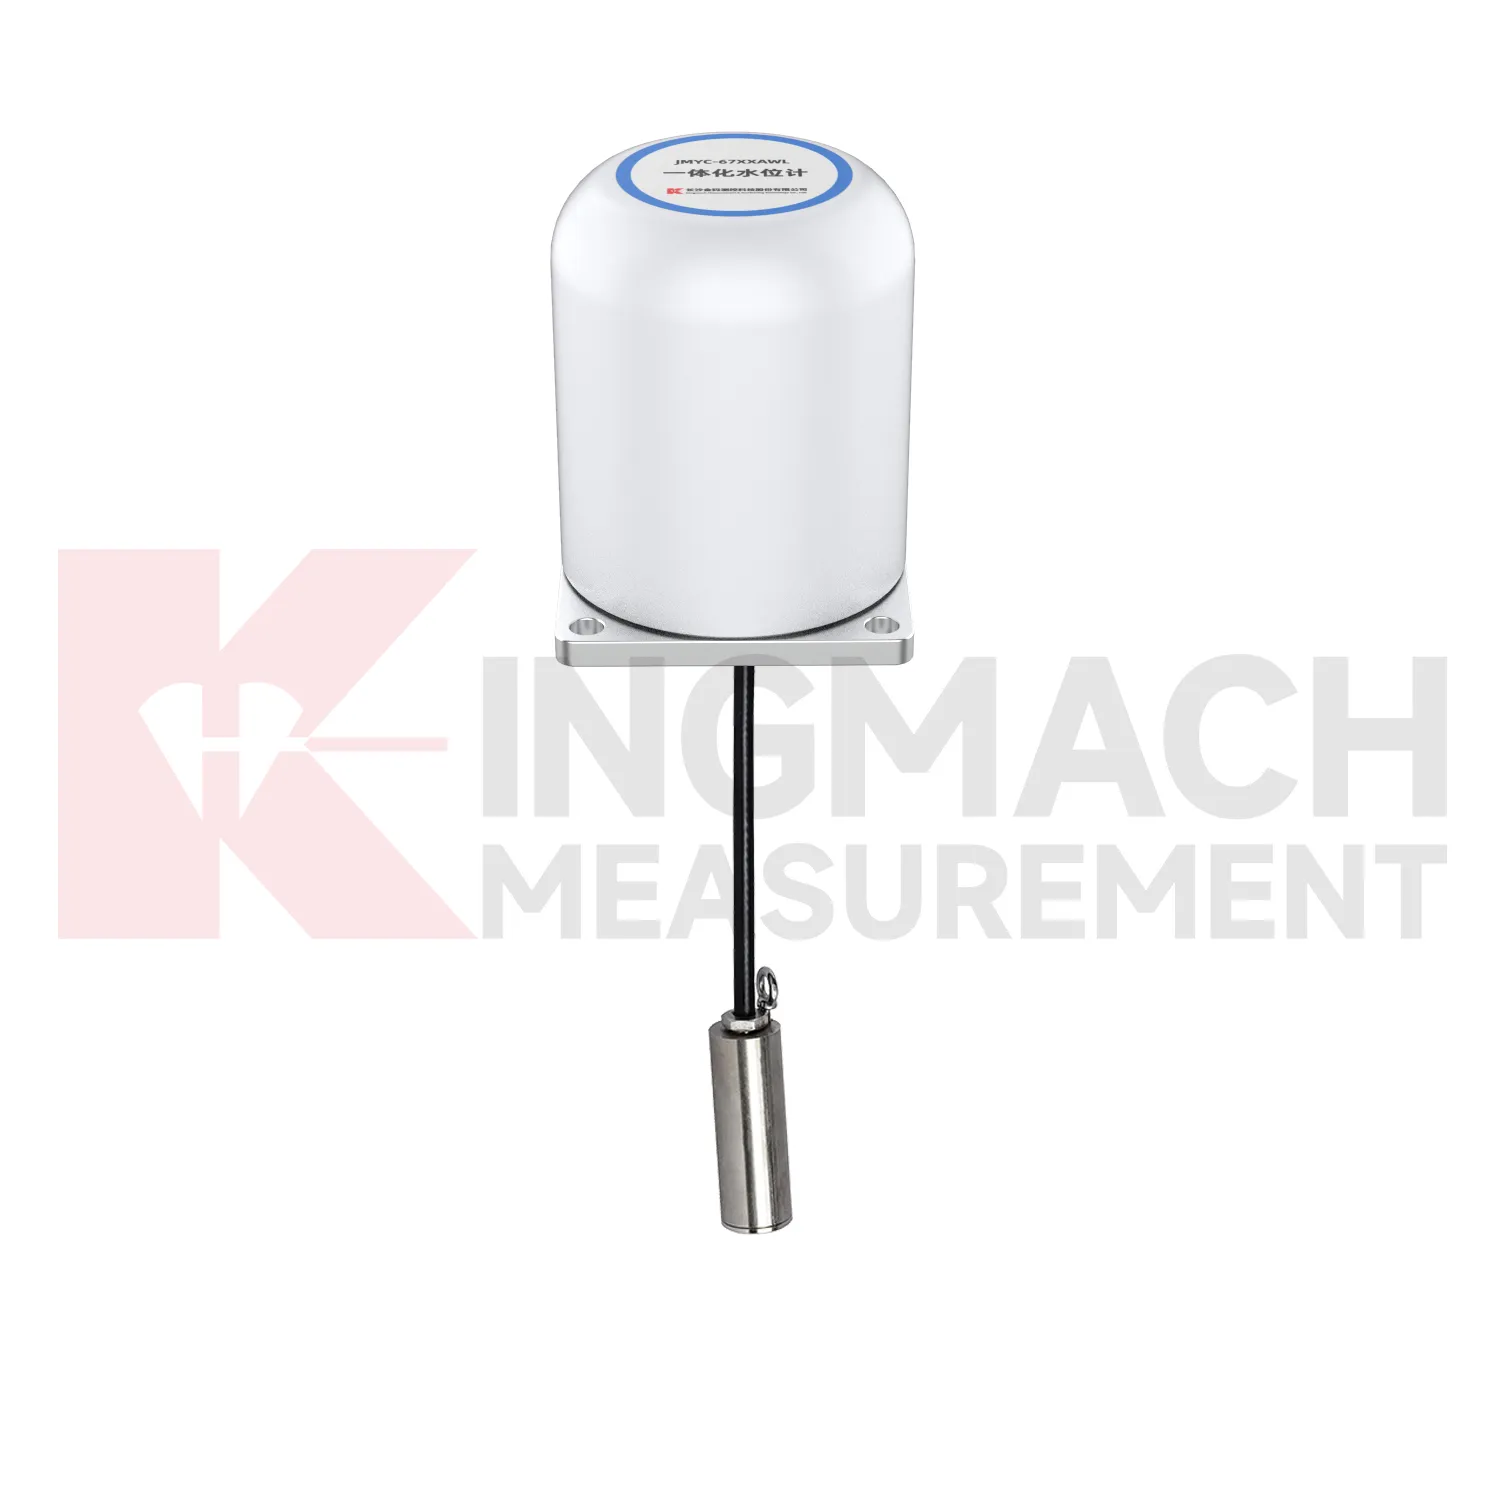
The next stage for load cell connection diagram in infrastructure monitoring is tighter integration with site data systems. Smart sensors already store model data, calibration coefficients, zero values, temperature readings, and measurement records on selected Kingmach products. The practical path is to connect that identity data with 4G, LoRa, wired acquisition, or 5G gateways, then place the force trend beside displacement, settlement, pore pressure, and rainfall in the same review screen. This matters because future warnings will be less about one limit value and more about patterns: force rising after excavation, anchor load falling after heavy rain, or bridge cable force drifting during seasonal temperature cycles. Digital twin models can use those readings when the sensor location, range, and calibration background are reliable. Standards and owner specifications for structural health monitoring are also becoming more data traceability focused, which favors instruments that can carry their own calibration identity and remain readable through long service periods.
Care & Maintenance of load cell connection diagram
Care for load cell connection diagram should separate the installation stage from the service stage. At installation, the goal is mechanical correctness: centered loading, clean contact surfaces, adequate plate thickness, no side load, no cable strain, and a documented zero reading. The JMZX-38XXHAT axial force meter has a 1 MPa waterproof rating, but connector sealing and cable protection still need field attention. Solid load cells list -30°C to 80°C working temperature and 0.5%FS precision, so records should include temperature during important readings. During service, the goal changes to trend reliability. Check whether readings shift after construction stages, heavy rain, traffic opening, reservoir level change, or support adjustment. Keep calibration documents and channel names consistent across manual and automated systems. Where smart sensors store measurement records, download or archive data before maintenance work that might disturb wiring. Most field problems can be prevented by dry connectors, protected cables, clear labels, and routine comparison with nearby monitoring points.
Kingmach load cell connection diagram
load cell connection diagram helps remove guesswork from load transfer, especially during construction stages that move quickly. Excavation, jacking, prestressing, concrete placement, reservoir impoundment, and staged traffic opening can all change force paths in hours. Kingmach smart sensor designs support digital output, long distance transmission, memory functions, and temperature correction on relevant models, which helps when manual reading windows are short. The point is not to collect more numbers for their own sake. The point is to catch a force trend early enough for the site team to check alignment, bearing plates, strut preload, grouting, drainage, or support sequence. A well installed sensor also leaves a handover trail for the owner. Later, when the structure enters service, the same point can be reviewed against seasonal effects and maintenance inspections. This keeps the force record tied to engineering behavior instead of scattered site notes. It should also record who accepted the first reading and which site event should trigger the next comparison.
FAQ
Q: When is a solid load cell connection diagram more suitable than a hollow type? A: Solid models are commonly used for compression load, pile load testing, bridge pier support checks, and heavy bearing capacity measurement. Q: What specifications does the Kingmach solid load cell list? A: The JMZX-35XXHAT line lists 1000 kN to 10000 kN ranges, 0.1 kN resolution, 0.5%FS precision, and -30°C to 80°C working temperature. Q: How much overload margin is listed? A: Product information lists 20 to 50%F.S. range overload and 300 to 400%F.S. failure overload. Q: What installation errors affect accuracy? A: Eccentric loading, uneven bearing plates, side load, cable pulling, and missing zero records can all distort results. Q: What records should be kept for acceptance? A: Keep calibration coefficient, model, serial identity, load stages, temperature, zero value, and readout setting.
Reviews
Michael Anderson
The strain gauges and load cells are extremely accurate and stable. They performed very well in our bridge monitoring project. Highly recommended!
James Thompson
The tiltmeters and accelerometers are very sensitive and provide precise data. Perfect for our structural health monitoring system.
Latest Inquiries
To protect the privacy of our buyers, only public service email domains like Gmail, Yahoo, and MSN will be displayed. Additionally, only a limited portion of the inquiry content will be shown.
Sophia***@gmail.comUnited Kingdom
Good day, we need environmental monitoring sensors including temperature, humidity, and wind sensors...
Isabella***@gmail.comGermany
Hello, we are evaluating weir flow meters for a water management project. Please share accuracy deta...